Definition: Tracking console errors in Google Analytics means taking error data from the browser and making it visible within Google Analytics. Combining the data allows you to use the power of GA to understand errors.
Jump to How do I do this?.
Jump to How do I do this?.
What are console messages?
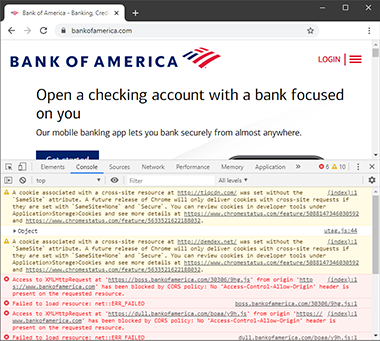
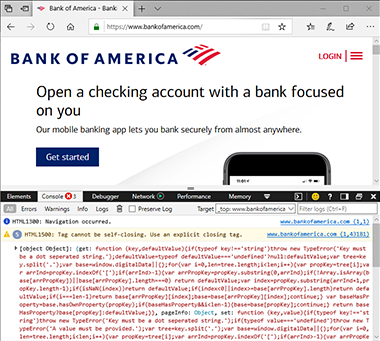
Console errors are informational, warning or error messages that appear in the devtools section of a browser.
These panels are hidden by default, and are only visible when you activate them (In Chrome and Firefox on Windows, press F12 to display the devtools window).
If you haven't seen devtools, or the developer toolbar, before press F12 on your keyboard if you're on a Windows device, or Ctrl Option J on a Mac to display it. You can also access developer toolbar on a mobile device.
Google defines the console as:
The Console has 2 main uses: viewing logged messages and running JavaScript.Kayce Bacques, Technical Writer for Chrome DevToolsDevTools offers more than Kayce suggests; it allow debugging of issues, reveals broken links and the console will also show you warnings and informational messages that can be important when you are looking to improve a website.
How are console errors generated?
Errors that appear in the console come from two places. Firstly, the browser may detect an issue and choose to add a message to the console. Secondly, the website, and the code within it, may decide to show a console message. The definition of "the website" is any code executed in the browser for that webpage, so it could include third-party scripts.
What types of message are shown?
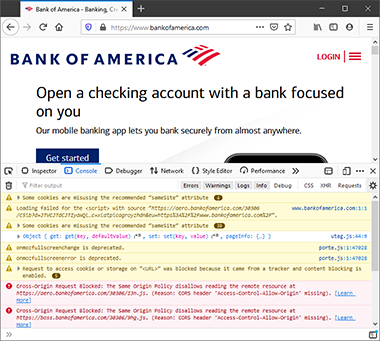
Browsers split messages into types. Warnings, Errors and Info messages will appear in all browsers. Each browser has additional types like Verbose, Logs and Debug.
If you're looking to optimize your website and ensure that users have the best experience then focussing on Errors and Warnings will help you understand what is failing.
- Chrome
- "Errors" - Lists critical error messages
- "Warnings" - non-critical issues
- "Info" - messages that contain no immediate issue
- "Verbose" - low level, uncritical information
- Firefox
- "Errors" - Lists critical error messages
- "Warnings" - non-critical issues
- "Logs" - similar to info,
- "Info" - messages that contain developer related information
- "Debug" - messages that have been added by developers to allow debugging
- Edge
- "Errors" - Lists critical error messages
- "Warnings" - non-critical issues
- "Info" - messages that contain no immediate issue
- "Logs" - lower level messages that may be used by developers
- Aggregate all the console error data over a period of time. For high volume websites a week of data, for lower volume websites a month
- Categorise the errors into Critical (Broken files, JavaScript errors), Warnings and Informational (Messages)
- Filter your list to focus on critical errors then rank the error messages by frequency.
- Prioritise fixing the errors with the highest frequency


Console Error Logs as displayed in Firefox developer toolbar.
Why should I care about console logs?
Problems with your site could mean problems for your users. JavaScript errors may mean the functionality of your site is broken, AJAX errors will indicate data that isn't pushed or pulled correctly. Broken files may mean an image now showing to a user. These are just some of the connections between an error showing in the console, and a user not having a good experience.
The challenge with console logs is that they're hidden by default and can be user specific. A developer testing their site may not see an error in the console, whereas a user (on a different browser, or having engaged with the site in a different way) may see errors and warnings. Seeing all the console errors that all users get will allow you to understand and prioritise fixes.
DevTools...help developers debug their apps effectively, and therefore find and fix the bugs faster.Prashant Palikhe, Rabobank
What do I do with console log data?
How to get visibility on console errors?
You could build your own JavaScript solution that will take error data and push it somewhere useful, like a database. You could build the JS, test it, create the end-point for the data, deploy it, then maintain it over time. It's the sort of solution that developers would want to build, but that resource would be better used elsewhere.
Trackerr is a plug-and-play solution that tracks console errors AND pushes the error data into Google Analytics. Simply add the Trackerr JavaScript via your Tag Manager and we'll automatically track, categorise and add the errors to GA. By using GA to track errors you'll be able to isolate errors down to segments, pages and sources. You will also be able to see the error count, see error volume over time, and do lots more thanks to the way that GA lets you interrogate data.